
ABH Site Index
 Historic Sites
Baseball History

For the history of baseball, check out our friends at Stat Geek Baseball and Baseballevaluation where they put the stats from 1871 to today in context.

Sponsor this page for $200 per year. Your banner or text ad can fill the space above.
Click here to Sponsor the page and how to reserve your ad.
- National Park Service Visitor Statistics
Top Twenty Most Visited Historic Sites 2016
Park Rank, Park - Recreation Visitors
1. Golden Gate NRA - 15,638,777
2. Blue Ridge Parkway - 15,175,578
3. Great Smoky Mountains National Park - 11,312,786
4. George Washington Memorial Parkway - 10,323,339
5. Gateway National Recreation Area - 8,651,770
6. Lincoln Memorial - 7,915,934
7. Lake Mead National Recreation Area - 7,175,891
8. Grand Canyon National Park - 5,969,811
9 . Natchez Trace Parkway - 5,891,315
10. Vietnam Veterans Memorial - 5,299,713
11. Independence National Historic Park - 5,067,510
12. Yosemite National Park - 5,028,868
13. World War II Memorial - 4,856,532
14. Chesapeake & Ohio Canal National Historic Park - 4,813,078
15. Castle Clinton National Monument - 4,812,930
16. Gulf Islands National Seashore - 4,771,309
17. Cape Cod National Seashore - 4,692,796
18. Rocky Mountain National Park - 4,256,888
19. Statue of Liberty NM - 4,501,547
20. Frandlin Delano Roosevelt Memorial - 4,360,502
History Photo Bomb

Number 2 on the Most Attended National Park Unit, the Blue Ridge Parkway.
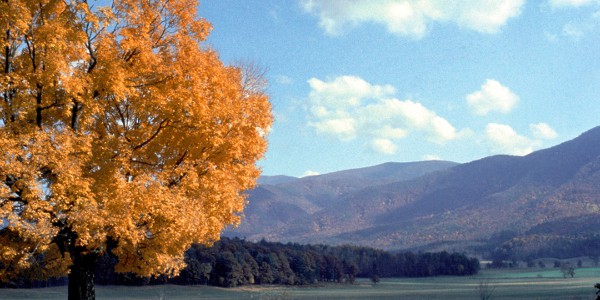
Great Smoky Mountains National Park, the #3 Most Visited Park in the nation.

Washington, D.C., includes six of the Top 20 most visited historic sites in the nation, including the George Washington Memorial Parkway, the Lincoln Memorial, the Chesapeake and Ohio Canal, the Vietnam Veterans Memorial, World War II Memorial, and the FDR Memorial.